

In part 1 I have explained how a relative simple spreadsheet can produce the concentration of an intravenous drug dose with given pharmacokinetic parameters that describe a 2 or 3 compartment model. In part 2, target controlled infusion(TCI) for blood control has been introduced together with a method to use two pharmcokinetic models in one simulation: the Eleveld model with and without opioid.
In this episode I add the effect compartment and the Emax model for the BIS, available in this relative new Eleveld population Pk/Pd model, the first 'universal' model for propofol. The principles on which the spreadsheets are built are similar for other drugs. So you could use these spreadsheets with a bit of parameter alteration for Lidocaine, Remifentanil, Sufentanil or whatever other drug that can be modelled with compartimental kinetics. In part 1 I have explained how you can verify your simulations with the original study data by what I called the overlaying technique. If your simulation does not fit then remember it could be the original study that is erronous. Some time ago I discovered a study that fitted a double effect compartment for propofol. For various reasons I considered this finding interesting, specially from a brain-fysiology point of view: after a forced receptor based hypnosis(first effect) the brain slowly 'settles' in the new situation(second effect) because stimulation of the brain is reduced. But I could not synchronise(overlay) my spreadsheet simulation with the graphs in the paper. I asked our mathematical whiz kid Eric Olofsen for help(again) and he discovered an error in the formulas that where used in the description of the model. This explained the discrepancy.
Let's dig in the spreadsheets that I developped for part 3. I have centralised the data that are used in the other sheets in a separate sheet called data. Patient data, Pk/Pd parameters, dilution , maximum pumprate etc are stored there. The effect compartment and related BIS is now implemented in the spreadsheets. Tricky part is the age dependent delay in the BIS. This is solved by making a lookup table from time and BIS and then selecting a time and BIS with the apropriate age dependent delay and putting that in the current time row. The simulations in part 2 of the blog considered two clinical scenarios:
- Eleveld model with opioid: starting induction in TCI mode without opioid and adding the oipoid after 5, 10 or 15 minutes
- Eleveld model no opioid: using TCI for sedation but start an opoid after 45, 60 and 75 minutes
Now with the implementation of the effect compartment and the related BIS we can workout what will happen with the effect in these scenarios. Let us again go trough the steps required to make these graphs
- In the TCI sheet set the <target[column B]> and set <opioid[Column D]> on (true in excel) in all rows
- <Inf(mg/hr)[Column F]> now holds the infusions that are calculated to obtain and maintain the required target, using the pk set with the opioid
- copy these infusion rates and
- paste them as formula results or values(excel) in the induction sheet on <Inf(mg/hr)[Column F]> Do not paste them directly because then you will paste the formulas in the cells, not the displayed values.
In numbers you can only select the pasting format in the edit menu at the top, in excel right mouse click can be used. - If the <opioid[Column D]>rows are selected (true in excel) then the concentrations must be equal to the concentrations in the TCI sheet. When deselecting <opioid[Column D]>rows (set false in excel) the non opioid pharmacokinetics are used in that row. Do that in all the rows for the period when no opioid was used.
- Finaly copy the results(values in excel) from each simulation to a place where they can be used for graphing. In my spreadsheet example I used column Q to AB plus the time in minutes [Column J] for the x axis.
For the other scenario: starting with TCI with no opioid and then administer opoid during a sedation you will need to do the oposite: TCI with no opioid, copy to the sedation sheet and switch on the opioid kinetics where apropriate.
Now to the results:
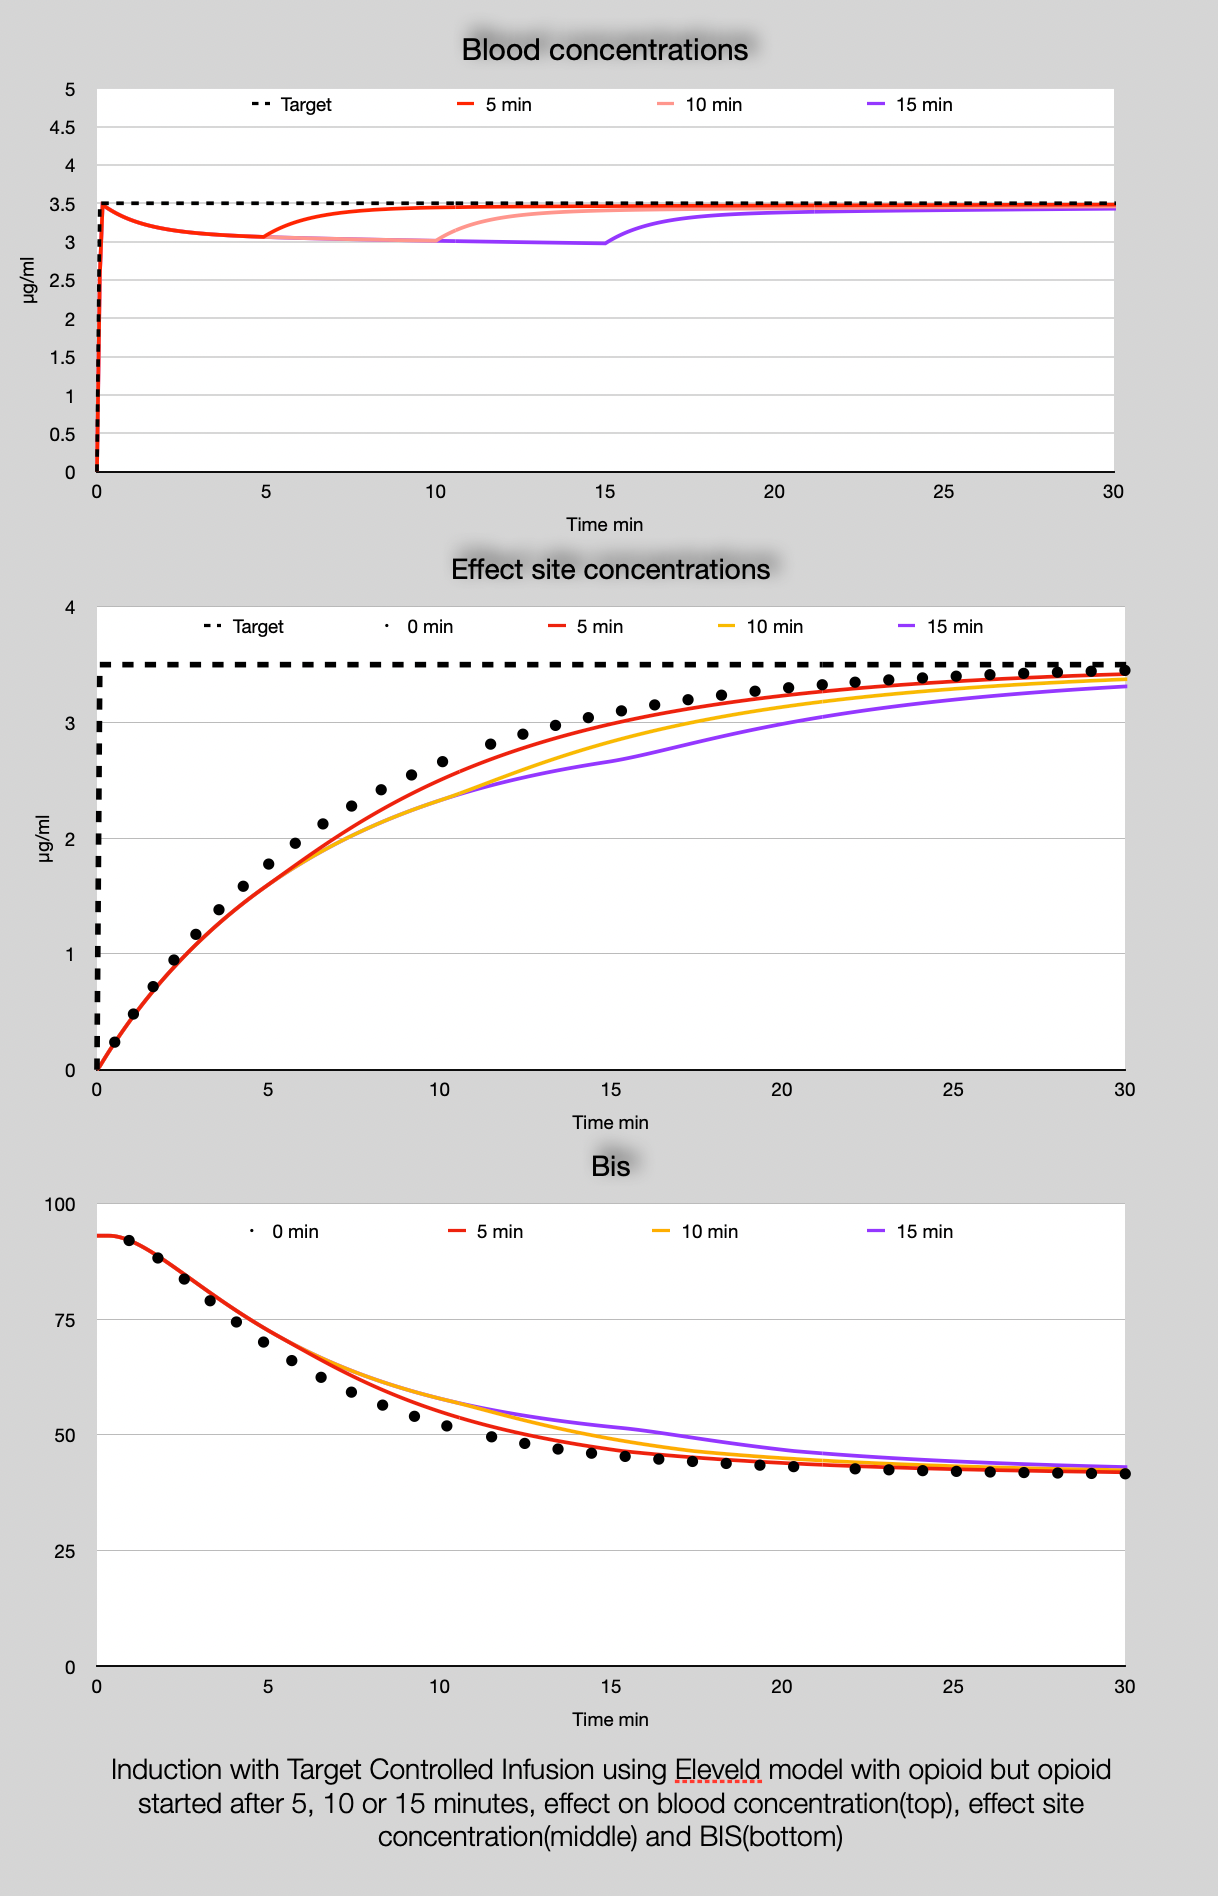
The magnitude of decrease in the bloodconcetration does not differ too much between 5, 10 and 15 min delay in the start of the opioid: ~15%. For the effect site concentration and the BIS the differences are more marked, although I doubt that this will clinicaly be noticable in particular looking at the minimal influence on the Bis in the 5 and 10 minutes delay in opioid administration.
What about the sedation scenario?
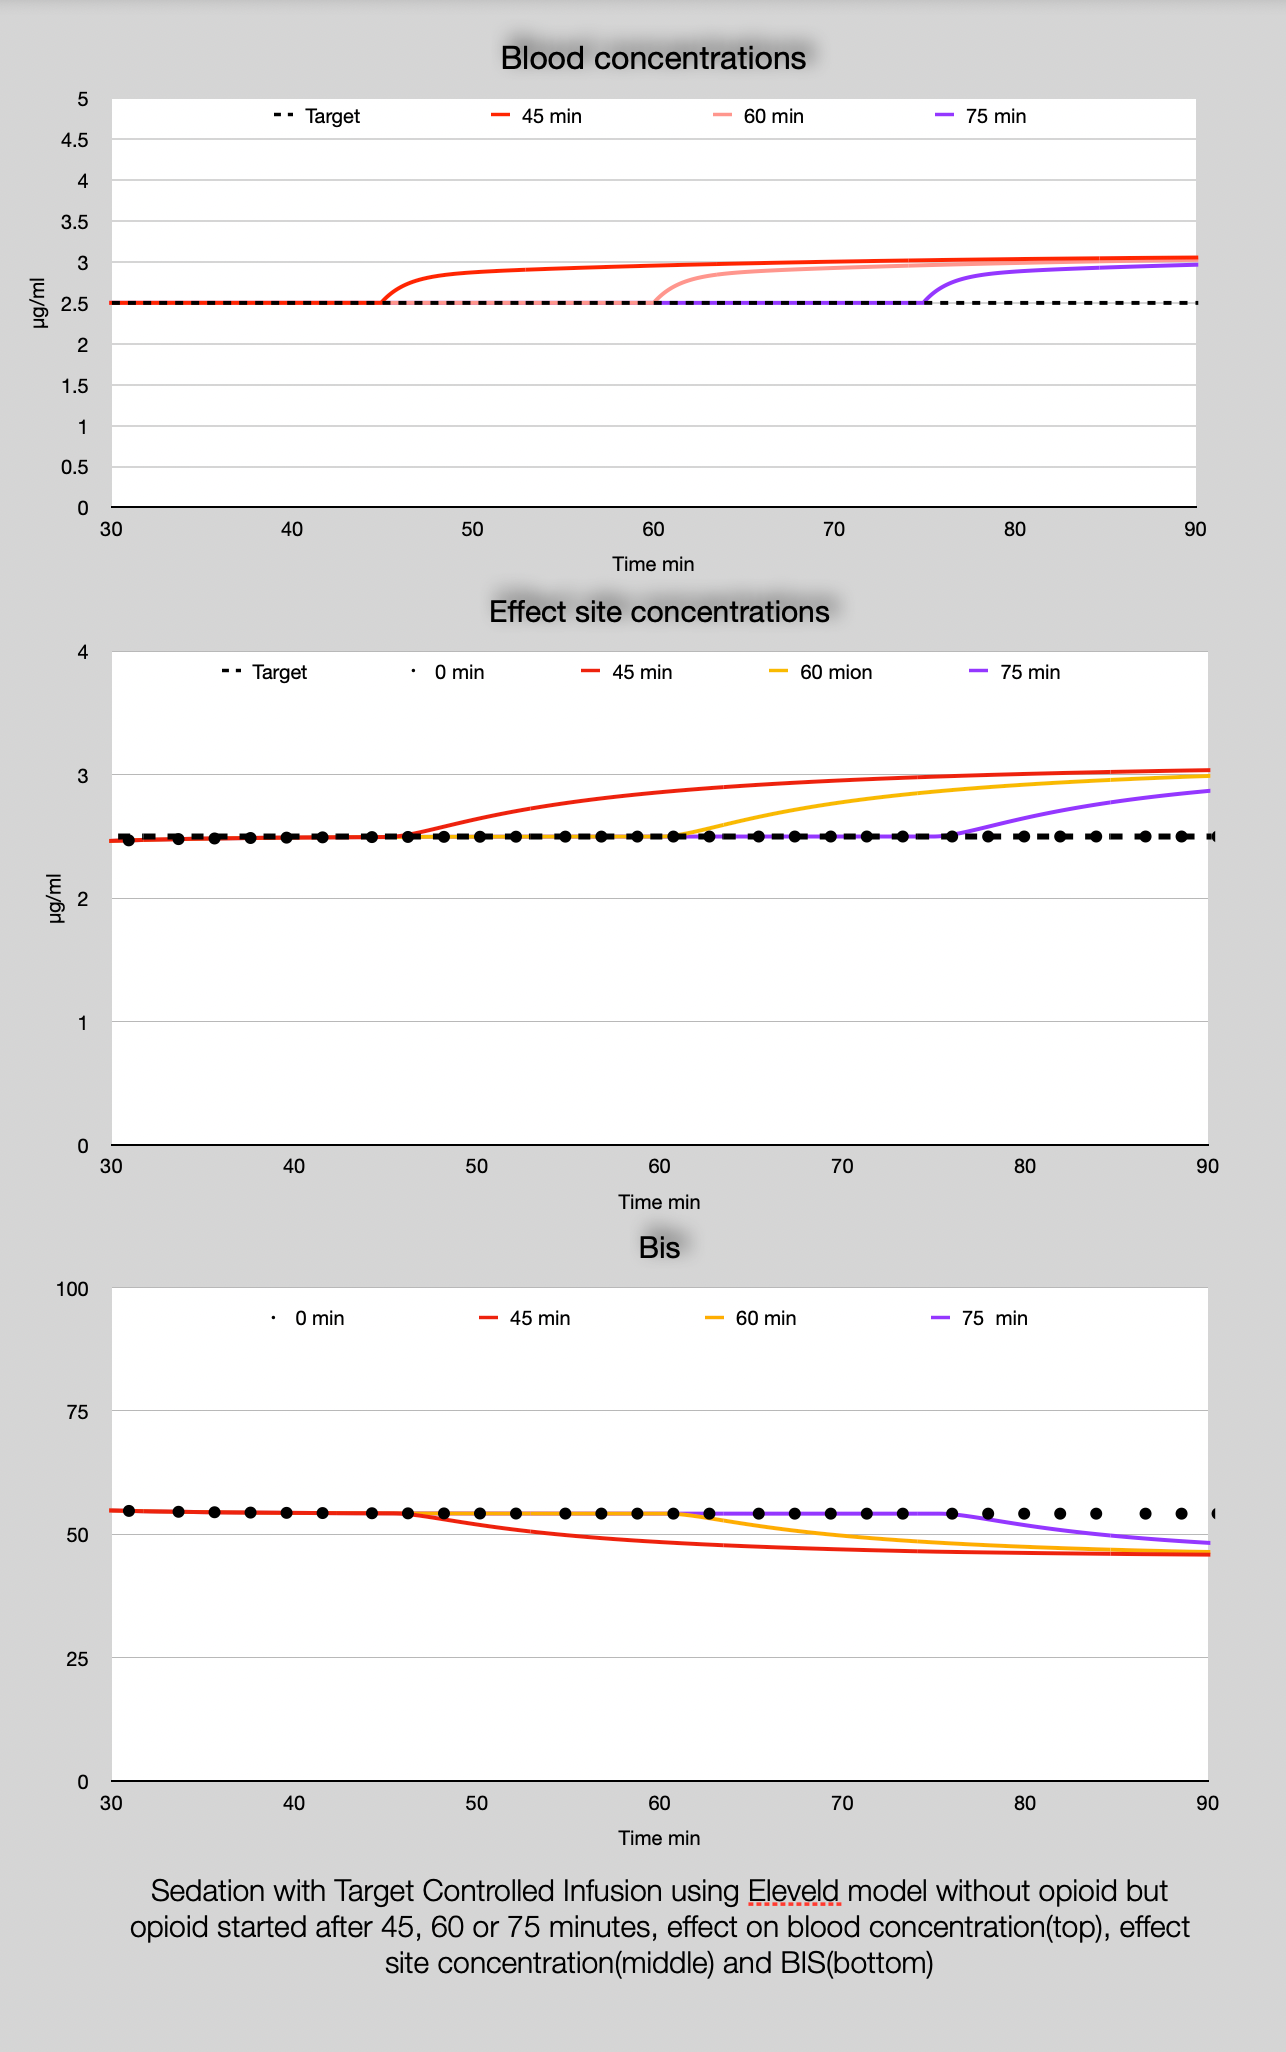
For the sedation scenario the smoothing out of the change in blood concentration by the effect compartment and BIS is remarkable. You may notice the change in BIS in practice since you now know it could be the effect of the opioid. Like I said before the effect of an opoid on the Bis in the Eleveld model is binary: it is there or not and is not dose or opioid type dependent. Most likely there is a relationship with the opioid concentration but even the large population studied is not large enough to reveal this and the available BIS data in the Eleveld study were rather limited. Maybe, maybe big data analysis may produce an answer in the future if the battle on the models has stopped and the same model is used for all the anaesthesia procedures.
You may notice that the simulations will predict a rather slow increase in the effect when using blood control TCI. In practice you will probably not wait for 10 minutes to see the BIS going down to 50(at least not in a healthy patient). But with the spreadsheets presented you can simulate other dosage schemes. The TCI sheet can handle changes up and down in the target concentration.The differences between patients,obese, peadiatric etc, can also be simulated with the spreadsheet.
I intended to stop the DiY blog here but after a holiday-long thinking I worked out a spreadheet that will approach effect compartment control. Effect compartment control needs a much more complicated algorithm as it has to look in the future to work out an infusion so that the effect compartment will achieve the target concentration as fast as possible without overshoot. In the last DiY pharmacokinetics blog I will show you this method and see how it influences the induction scenario, that we used above.
Considering the effect concentration, the Eleveld model without opioid is remarkable similar to the old Marsh model (for the default patient of 80 kg, 40 yr, 170cm at least). However Hernán Boveri from Buenes Aires has the experience that the Eleveld model with opioid performs better in clinical practice, specially when using a titrating technique during induction to effect. Maybe I can convince him to reveal this in a future blog.
If you use these simulations for education or any other purpose appart than solely for your own understanding than I hope you will reveal the source of your material as an appreciation of the work that has been put in:
Frank Engbers at Eurosiva.
Happy simulating!
Please use the box below for anonymous comments and questions.
Downloads: