

part 1:building and verifying the spreadsheet
This blog is about pharmacokinetics: Do It Yourself. Only a bit of knowledge of using spreadsheets is required.
If you read publications on pharmacokinetics you will have noticed that the model parameters are usually presented in two different notations: clearances V1,V2,V3,Cl,Cl2,Cl3 and time-constants(V1,k10,k21,k12,k13,k31). For a 3 compartment open model these 6 parameters describe the state of the model. To my knowledge the 2 and 3 compartment models with elimination from the central compartment are currently the only models used in modern infusion pumps that are capable of Target Controlled Infusion.
For the clearance annotation the parameters consist of the volumes of the compartments V1, V2, V3 and the clearances (vol/time) to the outside: central clearance Cl and inter-compartmental clearances Cl2 and Cl3 often called Q2 and Q3.
For the time constant annotation, it is the volume of the central compartment V1 and the time constants in-between de compartments k12 , k21, k13, k31 (/time) and to the outside k10(/time) that describe the model.
The two annotations are interchangeable by using simple formulas (see table 1). Having said that, when population parameters are connected to the model parameters, the interpretation of specially V1 becomes tricky. I have tried to explain this in the addendum of:
Engbers, F. H. M. & Dahan, A. Anomalies in target‐controlled infusion: an analysis after 20 years of clinical use. Anaesthesia 73, 619–630 (2018).
Solving the pharmacokinetic equations for a 3 compartment model can be done analytical. With that approach the concentration can be calculated at any point in time given that the state of the model is unchanged. The state of the model changes when there is a change in input, for example a bolus or a change of infusion, or when one of the parameters changes because it is connected to an external parameter like an opioid on board or no opioid, which is the case in the Eleveld model. The latter state change has not been used in commercial TCI systems. It is unlikely that this will ever be incorporated because it will increase the complexity of the Target Controlled Infusion system and hence make it more error prone.
The concentration can also be calculated using a relative simple numerical approximation of the equations. The exponential curves basically are cut into small steps that are assumed to be horizontal and linear. The smaller the steps the higher the accuracy. This is known as the Euler technique, named after and invented by the famous mathematician from the 18th century. For pharmacokinetic calculations a step size of 5 second gives sufficiently accurate outcomes, but you can try for yourself with the downloadable spreadsheet.
We are going to use the time-constant notation for simplicity.
The model is based on the amounts present in the compartments. A certain amount in mg is going into the model as input. A bolus(B) is considered to immediate being added to the model, for an infusion we will calculate the dose in the step change that we use to evolve the model: in our case 5 second. In fact the infusion is split up to small boluses(Inf) as long as the infusion runs. We transfer the infusion from mg/hr to mg/sec and we only have to multiply that with the step size in seconds to know what is going in, in each step.
From that Amount(A1) during 1 second A1 x k12 will go to the second compartment to create an amount there:A2. Similar for the third compartment A1 x k13 will build the amount A3, and drug is also cleared: A1 x k10. But the central compartment is not only losing drug: drug will come back from the other compartments: from the second: A2 x k21 and from the third A3 x k31.
So the amount change in the central compartment over a period of T seconds is what goes in minus what leaves the central compartment:
\(B+(Inf+A_2 * k_{21}+A_3 * k_{31}-(A_1 * k_{10}+A_1 * k_{12} + A_1 * k_{13}) ) * T\)
this change must be added to the amount already present, which is stored in the cell above the current one.
For the second compartment the change is similar: what goes in minus what goes out:
\((A_1 * k_{12} - A_2 * k_{21} ) * T\)
and for the third compartment:
\((A_1 * k_{13} - A_3 * k_{31}) * T\)
These changes again have to be added to the amount already present in the respective compartments. The central concentration can be derived by dividing A1 by the known volume of V1 and adjusting for the units difference between input(mg) and required concentration(mcg).
The final challenge is the calculation of the 6 parameters in the two Eleveld models and putting everything in a spreadsheet. I have used the worked out calculation I use in Tivatrainer(X). The outcome of these calculations have been checked with the author of the models: Douglas Eleveld, as there was a typo in the initial publication. All parameters are calculated independently therefore they look a bit weird and complicated, even more than in the original paper. This was necessary as Tivatrainer could only parse(translate) the individual Pk parameter values.
We can use the equations in table 1 to transfer the results of the calculations that are annotated as clearances to the time-constant annotation.
In this first part I have built a spreadsheet to do the calculations with the Eleveld model without opioids. There are two versions, one Numbers for macOS and an Excel version. The operation of these spreadsheet is simple and based on the typical copy/paste functionality of the spreadsheets. A typo is easy made so the spreadsheets had to be verified on correctness.
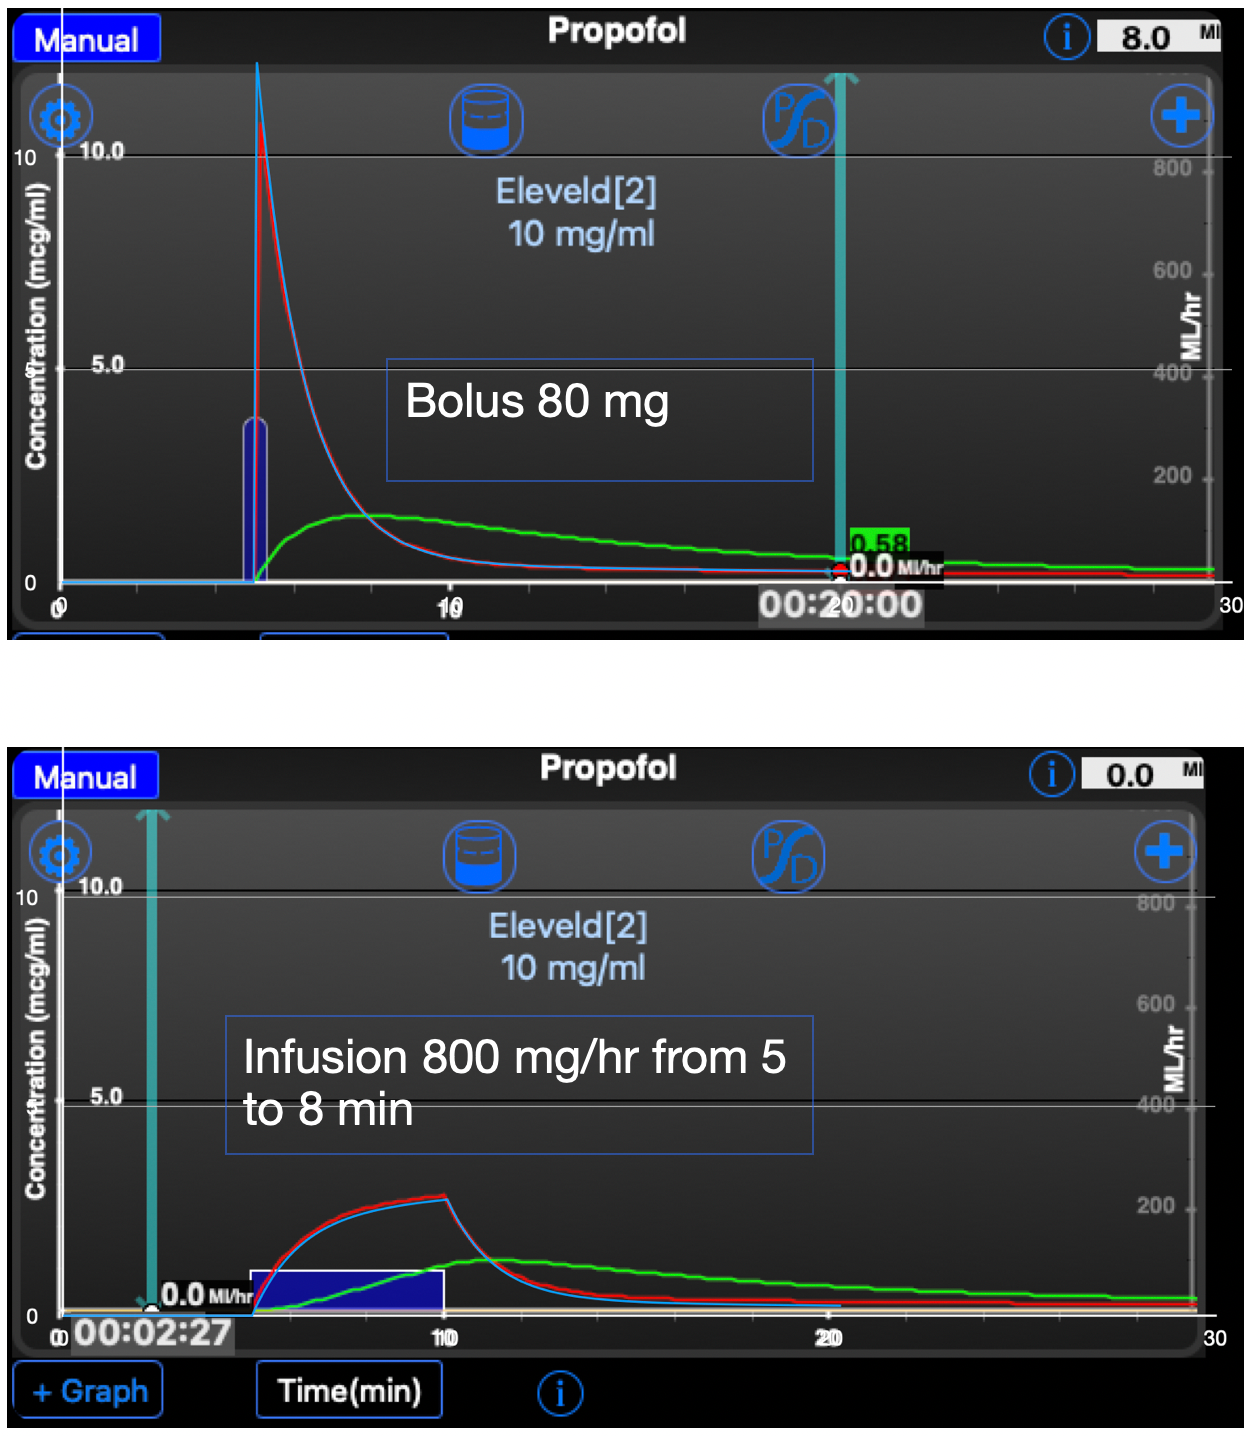
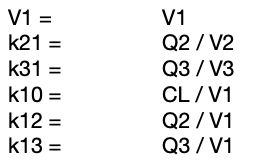
I have used TivatrainerX that runs on iPhone and the new MacBooks with M1 and M2 processor. I have made a screenshot and put that into the Numbers spreadsheet application and set it to the background. The data from the spreadsheet are fed into a 2d scatter chart that has been overlayed over the screenshot. By resizing that chart with dragging, the axes are fitted to the axes of the TivatrainerX screenshot. I needed a shift of one pixel otherwise the red line would be fully covered. The blue line is from the spreadsheet simulation, the red one from TivatrainerX. You may notice that the predicted peak concentration of tivatrainer is a bit lower than the concentration in the spreadsheet. This is not an error. In the TivatrainerX app the graph is drawn from the point where the bolus is given to one second after that moment. TivatrainerX uses the analytical calculation of the concentration so this is merely a consequence of the way the concentrations are displayed.
From the bolus and infusion comparison it is clear that the 5 second interval is accurate enough for the purpose of this excersise.
By the way, this overlaying technique is also very useful for verifying the data during the review of publications, specially when no detailed concentration data are supplied. More than once I discovered errors both in the representation of data from the study as well as in the conceptual setup of a study, using this simple technique.
Engbers F. Is unconsciousness simply the reverse of consciousness? Anaesthesia. 2018 Jan;73(1):6-9. doi: 10.1111/anae.14121. Epub 2017 Oct 23. PMID: 29057452.
Non-mac users can accomplish the same with exporting screenshots to Adobe photoshop or Adobe illustrator or similar software. You will have to transfer the screenshot to PNG format as this will allow you to set the required transparency. For not-so-familiar-with-spreadsheet-colleagues, I have made a small video to explain how to operate the spreadsheet. It is based on the powerful copy and paste function of spreadsheets. In the following blog I will add the Eleveld model with opioid. In that spreadsheet it will be possible to change the model in every 5 second epoch. So we can study the prediction of starting with no opioid and adding opioid later. If there is enough interest I will thereafter incorporate the effect compartment and the related pharmacodynamic effect. We can even go one step further and build complex models with transient compartments like is done in this paper:
Masui, K. et al. Early phase pharmacokinetics but not pharmacodynamics are influenced by propofol infusion rate. Anesthesiology 111, 805–817 (2009).
For now it is sufficient to know that without using elaborate software it is possible to accurately calculate concentrations of IV drugs. The numerical approach can be used to make advanced models, check existing models or extrapolate models to answer ‘what if’ questions. If you measure the weight of a fluid as the output of your pump you can even use it to verify that your TCI system works correct. I will publish this technique in a separate paper. Please use the comment box below for questions, criticism or a simple thumbs up for keeping us going. If you use your email address to do that, we will send you a mail when the next part is published. Stay tuned!